
The number of children per household has been steadily increasing for decades. At the same time, the cost of raising children has also been on the rise. As these trends extend into the future, large families in high-cost-of-living areas will feel the growing burden of high child-rearing costs more than others. Researchers at RetailMeNot analyzed data from the U.S. Census Bureau to find which cities have the largest families.
Lifestyle
The 15 cities with the largest families
By

According to Census Bureau data, the average number of children per family has been rising in recent years. This trend can be seen among both married-couple households and single-parent households. In 2019, married-couple households with kids under age 18 had 1.98 kids on average, compared to 1.85 and 1.68 kids for single-mother and single-father households, respectively.
As the average number of children per household continues to rise, the cost of raising children is higher than ever before. According to the U.S. Department of Agriculture, the cost of raising a child born in 2015 from birth to age 17 is over $230,000. Parents who help pay for college education face even larger costs. The most recent data from the U.S. Census Bureau shows that there is an average of 1.88 children in households with children under 18, meaning families could face total child-rearing costs upwards of $400,000.
Family size varies across the country due to both cultural reasons and differences in living costs. Researchers at RetailMeNot found that at the state level, Utah and Idaho families have the largest number of kids on average, at 2.31 and 2.11 kids per family, respectively. At the low end, Maine and Rhode Island families tend to have fewer kids with averages of 1.76 and 1.75 kids per family.
To find the metropolitan areas with the largest families, researchers at RetailMeNot looked at the latest data from the U.S. Census Bureau and the Bureau of Economic Analysis. The researchers ranked metro areas according to the average number of kids per family. Researchers also calculated the proportion of families with kids headed by a single parent, median household income for dual-parent households, median household income for single-parent households, and the cost of living relative to the national average.
To improve relevance, only metropolitan areas with at least 100,000 people were included in the analysis. Additionally, metro areas were grouped into the following cohorts based on population size:
- Small metros: 100,000–349,999
- Midsize metros: 350,000–999,999
- Large metros: 1,000,000 or more
The metros with the largest families tend to be located in the West, Southwest, and Midwest. Utah metros claim the number one spots across all metro size cohorts, reporting the most kids per family. In general, the metros with the largest families tend to have lower costs of living than the national average, making it easier for families to afford a larger number of kids.
Across all metros with the largest families, dual-parent household income tends to be much higher than single-parent household income. However, apart from locations in Utah—which have large families and few single-parents—there isn’t a strong relationship between family size and the share of single-parent households at the metro level.
Here are the metropolitan areas with the largest families.
Large Metros With the Biggest Families
15. Oklahoma City, OK
- Average number of kids per family: 1.90
- Proportion of families with kids headed by a single parent: 24.2%
- Median household income (dual-parent households): $81,000
- Median household income (single-parent households): $30,374
- Cost of living: 9.3% less than average
14. San Antonio-New Braunfels, TX
- Average number of kids per family: 1.90
- Proportion of families with kids headed by a single parent: 26.7%
- Median household income (dual-parent households): $81,400
- Median household income (single-parent households): $30,681
- Cost of living: 6.1% less than average
13. Kansas City, MO-KS
- Average number of kids per family: 1.90
- Proportion of families with kids headed by a single parent: 23.0%
- Median household income (dual-parent households): $97,334
- Median household income (single-parent households): $33,872
- Cost of living: 7.1% less than average
12. Dallas-Fort Worth-Arlington, TX
- Average number of kids per family: 1.90
- Proportion of families with kids headed by a single parent: 22.6%
- Median household income (dual-parent households): $93,000
- Median household income (single-parent households): $35,566
- Cost of living: 0.7% greater than average
11. Memphis, TN-MS-AR
- Average number of kids per family: 1.91
- Proportion of families with kids headed by a single parent: 35.2%
- Median household income (dual-parent households): $86,199
- Median household income (single-parent households): $25,404
- Cost of living: 9.8% less than average
10. Las Vegas-Henderson-Paradise, NV
- Average number of kids per family: 1.91
- Proportion of families with kids headed by a single parent: 26.6%
- Median household income (dual-parent households): $75,116
- Median household income (single-parent households): $33,516
- Cost of living: 3.2% less than average
9. Cincinnati, OH-KY-IN
- Average number of kids per family: 1.91
- Proportion of families with kids headed by a single parent: 24.4%
- Median household income (dual-parent households): $100,559
- Median household income (single-parent households): $29,326
- Cost of living: 10.0% less than average
8. Houston-The Woodlands-Sugar Land, TX
- Average number of kids per family: 1.91
- Proportion of families with kids headed by a single parent: 22.4%
- Median household income (dual-parent households): $90,388
- Median household income (single-parent households): $31,739
- Cost of living: 1.8% greater than average
7. Tucson, AZ
- Average number of kids per family: 1.92
- Proportion of families with kids headed by a single parent: 27.6%
- Median household income (dual-parent households): $74,096
- Median household income (single-parent households): $28,587
- Cost of living: 6.1% less than average
6. Grand Rapids-Wyoming, MI
- Average number of kids per family: 1.95
- Proportion of families with kids headed by a single parent: 21.0%
- Median household income (dual-parent households): $90,034
- Median household income (single-parent households): $31,528
- Cost of living: 7.8% less than average
5. Milwaukee-Waukesha-West Allis, WI
- Average number of kids per family: 1.95
- Proportion of families with kids headed by a single parent: 28.3%
- Median household income (dual-parent households): $103,311
- Median household income (single-parent households): $30,739
- Cost of living: 5.2% less than average

Photo Credit: Alamy Stock Photo
4. Minneapolis-St. Paul-Bloomington, MN-WI
- Average number of kids per family: 1.95
- Proportion of families with kids headed by a single parent: 18.6%
- Median household income (dual-parent households): $115,425
- Median household income (single-parent households): $41,805
- Cost of living: 2.6% greater than average

Photo Credit: Alamy Stock Photo
3. Phoenix-Mesa-Scottsdale, AZ
- Average number of kids per family: 1.98
- Proportion of families with kids headed by a single parent: 22.3%
- Median household income (dual-parent households): $83,898
- Median household income (single-parent households): $35,862
- Cost of living: 1.9% less than average

Photo Credit: Alamy Stock Photo
2. Riverside-San Bernardino-Ontario, CA
- Average number of kids per family: 1.99
- Proportion of families with kids headed by a single parent: 20.6%
- Median household income (dual-parent households): $75,116
- Median household income (single-parent households): $31,861
- Cost of living: 7.0% greater than average

Photo Credit: Alamy Stock Photo
1. Salt Lake City, UT
- Average number of kids per family: 2.16
- Proportion of families with kids headed by a single parent: 16.0%
- Median household income (dual-parent households): $89,026
- Median household income (single-parent households): $40,000
- Cost of living: 1.3% less than average
Detailed Findings & Methodology
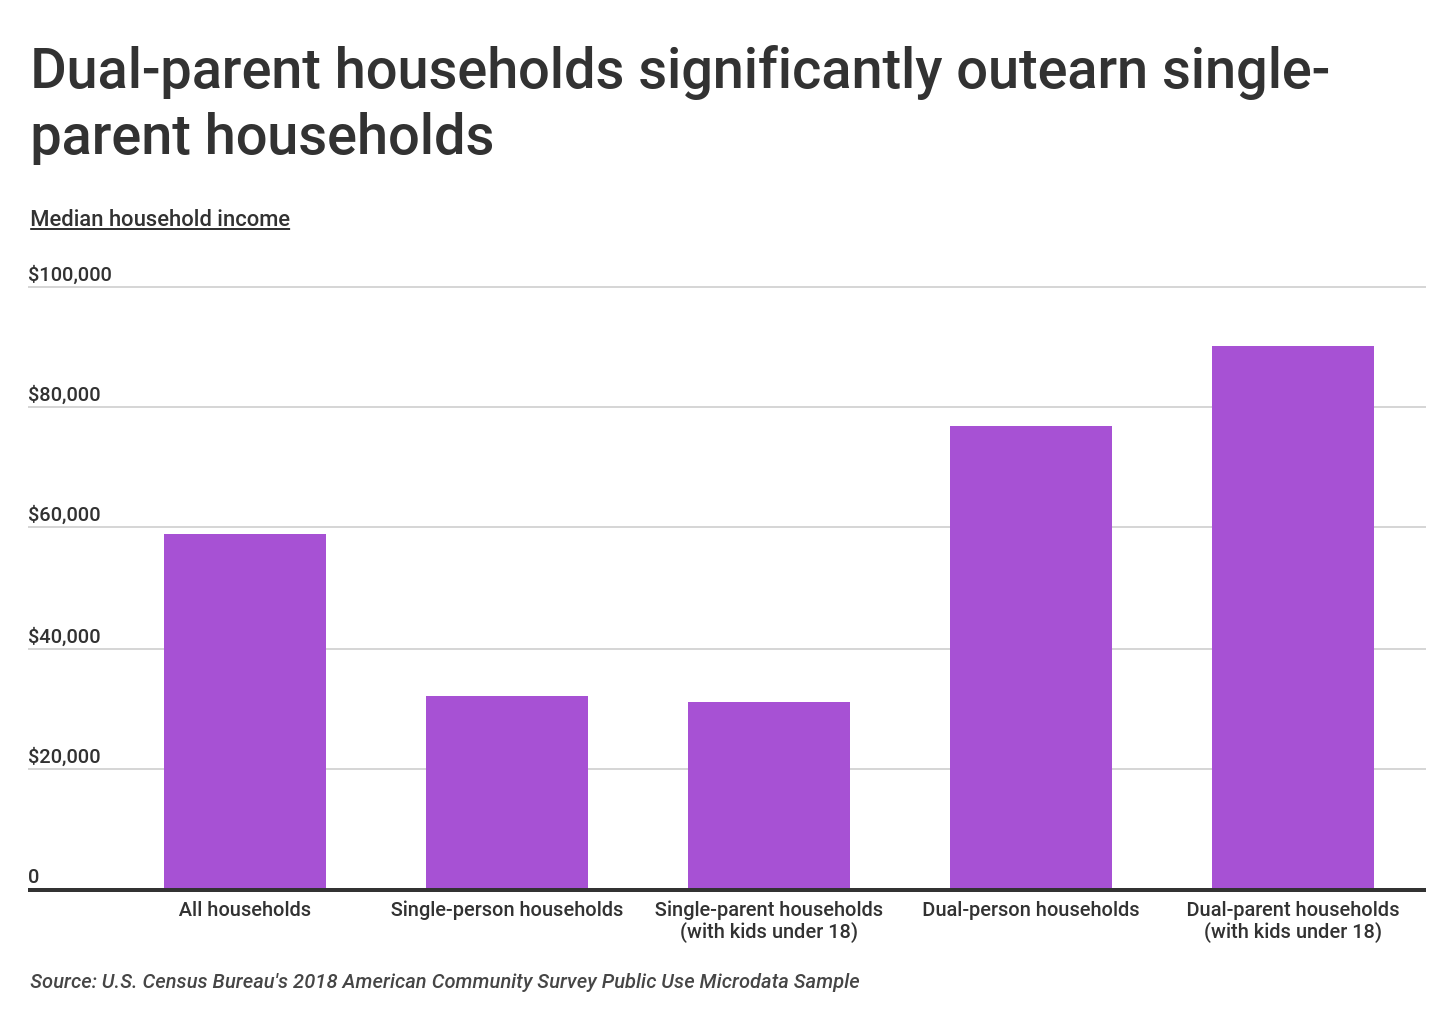
Despite a long-term negative relationship between income and fertility, fertility rates among wealthy Americans are rising. This can partly be explained by rising inequality and the resulting decline in child care costs relative to income for high-income families. According to the most recent data from the Census Bureau, dual-parent households earn significantly more than single-parent households. The median household income for dual-parent households with kids under 18 is nearly $90,000, compared to $31,000 for single-parent households. Paying for all of the expenses associated with raising children can be especially challenging for single parents. These include both big expenses, like child care and college, as well as many smaller items that add up, such as cribs, strollers, toys, and clothing.
To determine the metros with the largest families, researchers at RetailMeNot analyzed the latest data from the U.S. Census Bureau’s 2018 American Community Survey Public Use 5-Year Microdata Sample (ACS PUMS) and the Bureau of Economic Analysis’s 2018 Regional Price Parity (RPP) data. The researchers ranked metro areas according to the average number of kids per family. In the event of a tie, the metro with more households with kids under 18 was ranked higher. Researchers also calculated the proportion of families with kids headed by a single parent, median household income for dual-parent households, median household income for single-parent households, and the cost of living relative to the national average.
Only metropolitan areas with at least 100,000 people were included in the analysis. Additionally, metro areas were grouped into the following cohorts based on population size:
- Small metros: 100,000–349,999
- Midsize metros: 350,000–999,999
- Large metros: 1,000,000 or more


Leave a Reply